
From within the Execution Queues window, click on the Monitoring tab to see status information for the playback.
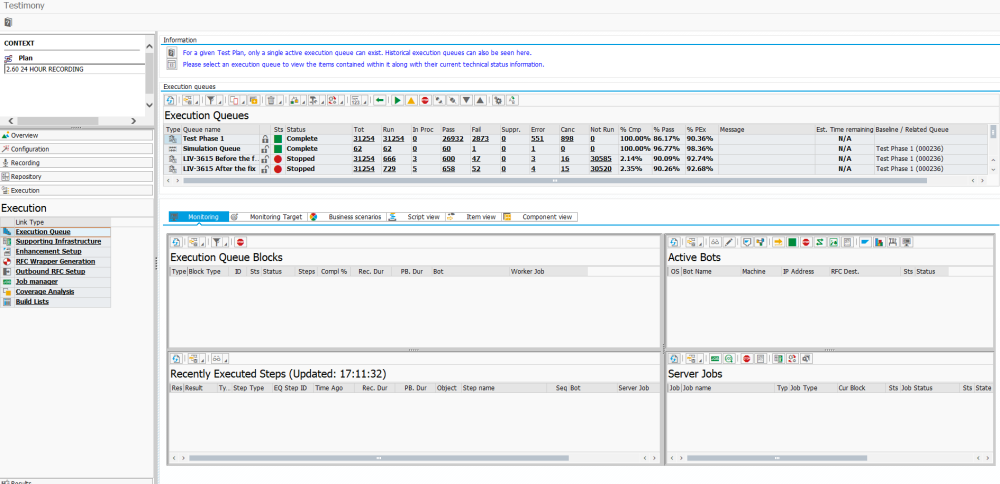
This shows information on (reading clockwise from top-left) the currently-running execution queue blocks; the active Bot(s); the jobs that are running in the central system to manage the playback; and the most recently executed steps.
You can refresh the top-level to update all the individual results windows, or you can refresh each window independently. You can also log into the Target system to view currently running activities.
If you have visibility of the bot machines, you should start to see the bots performing the playback steps. This might be via the SAP GUI, but equally the console will show you if it is running other steps such as RFC’s and batch jobs.
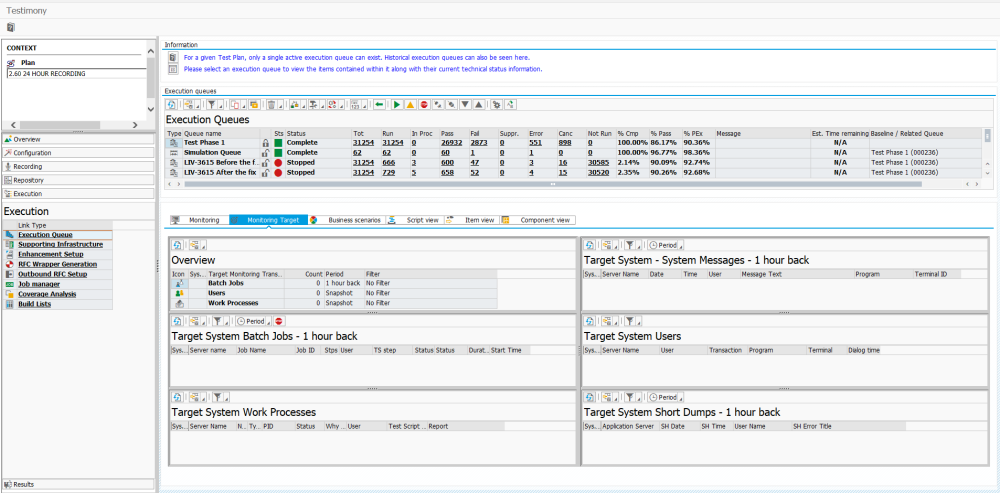
When a playback is executing, what is going on in the target system is critical in understanding potential problems that might arise. Visibility into the target system and what is going on there is now available through the execution queue monitoring.
Previously, access to the target system was required to gain visibility of what was going on in the system
There are 6 screens available for display:
Batch Jobs (SM37) – Shows current and recently executed batch jobs
Work Processes (SM66) – Shows what WP’s across app servers are doing
System Messages (SM21) – Shows recent system messages
Current Users (AL08) – Shows currently logged on users across the system
Short-Dumps (ST22) – Shows recent short-dumps in the target system
Summary – Provides a summary of the above 5 screens
Post your comment on this topic.