
ActiveDiscover impact assessment score is displayed in ActiveControl based on a 3-level hierarchy as follows.
- Level 1 – Display of ActiveDiscover impact assessment score either as a gauge chart or RAG status depending on the ActiveControl application area.
![]()
Image AC18-1: Impact assessment score as a gauge chart
![]()
Image AC18-2: Impact assessment score as a RAG status


- Level 2 – Clicking on the level 1 gauge chart or RAG status to view details will then present an ActiveDiscover “Impact Analysis Summary” dialog box.
![]()
Figure AC118-1: Impact Analysis Summary dialog box
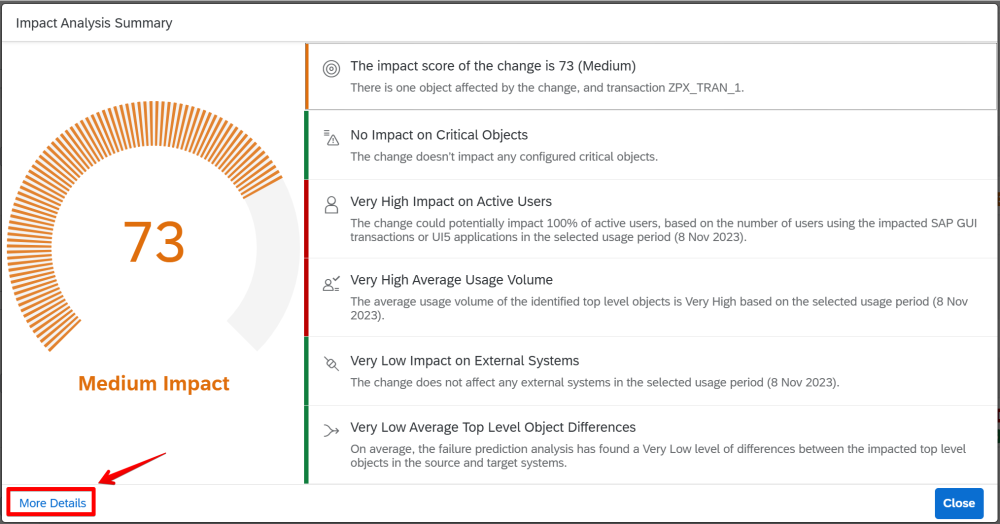
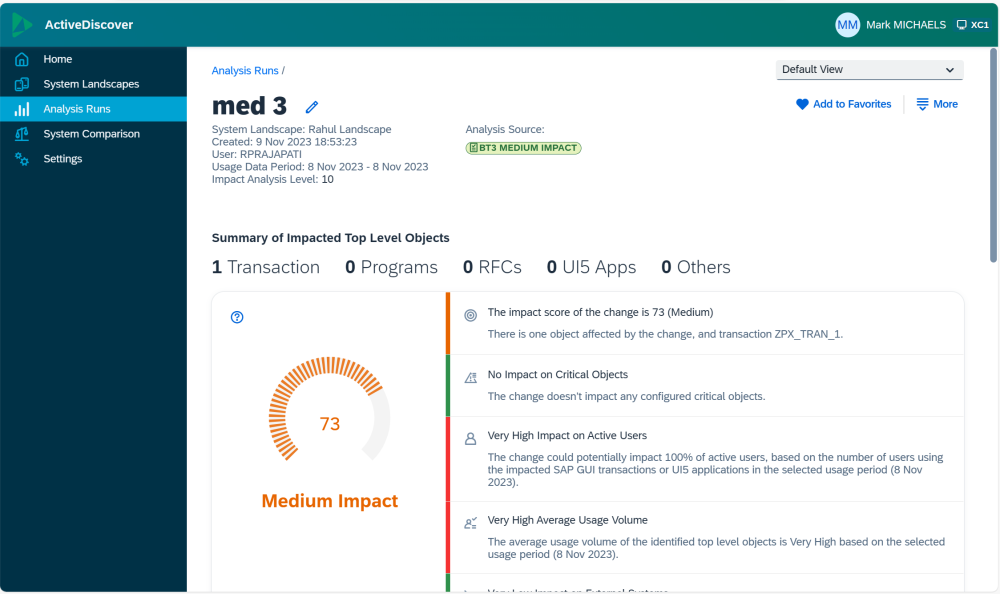
- Level 3 – If detailed analysis of the impact assessment score is required, then clicking on the More Details text on the “Impact Analysis Summary” dialog box will redirect the navigation to the main dashboard of ActiveDiscover by opening a new tab in the existing browser.
![]()
Figure AC118-2: ActiveDiscover main dashboard
Post your comment on this topic.