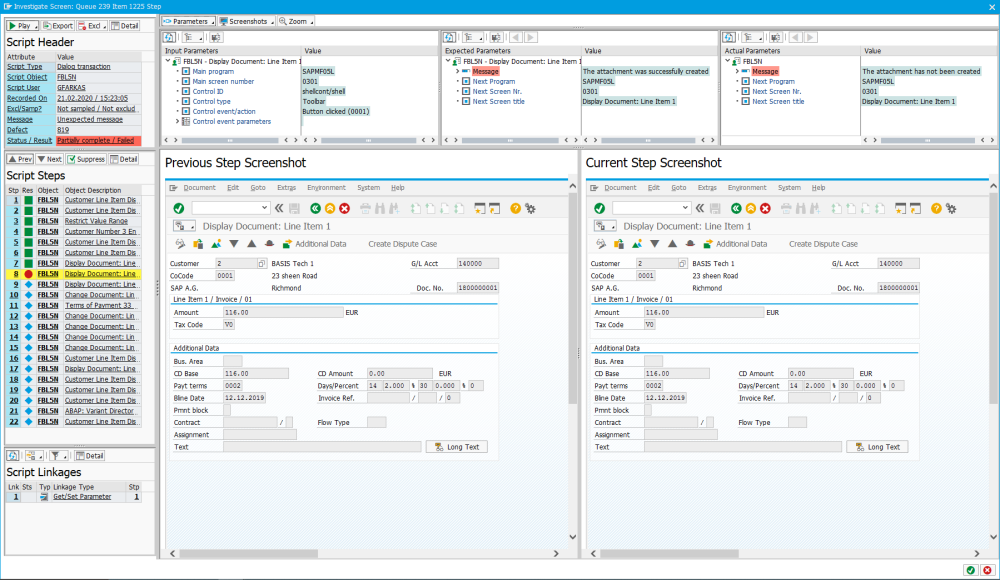
The following changes have now been implemented in v2.21 of Testimony to show significantly more details to the user when investigating a script failure.
An example of the new investigate screen is shown here:
Queue Information
At the top of the investigate screen you can now see the execution queue ID and the item ID within that queue (within the window title). The format of the title is “Investigate Screen: Queue X Item Y”.
Header Information
The grid in the top left representing the Script Header contains key information relating to the script that is being investigated. These include:
- Script Type – The type of script that is being investigated (e.g. Dialog transaction)
- Script Object – The name of the object representing the script (e.g. transaction VA01)
- Script User – The user who executed the script in the playback system
- Recorded On – The date and time that the script was recorded
- Excl/Samp – Information on whether this object is excluded or sampled in any way in the filter set configuration
- Message – If there is a message relating to the script (e.g. the failure reason) then this is shown here
- Defect – If a defect has been generated for this script then the defect number is displayed here
- Status / Result – Display the overall status of the script and whether it passed or failed
Additionally, you can perform the following:
- Display the related defect – If a defect number is shown, by selecting the hot-spot the defect details will be displayed
- Display the test script header – By selecting any other hot-spot area in the grid, the test script header will be displayed
Toolbar Actions
Within the toolbar of the header, you can perform the following actions:
- Export the data – This requires you switching to the old investigate screen and then exporting the script data from there
- Setup Exclusions – If this object should be excluded or sampled going forward, you can add it directly from here
- Details of test script – In the same way that you can click on various hot-spots in the grid, you can also click here to display the test script header
- Trigger playback remote control – This lets you re-run the script, step by step, with a bot that needs to be started.


Post your comment on this topic.