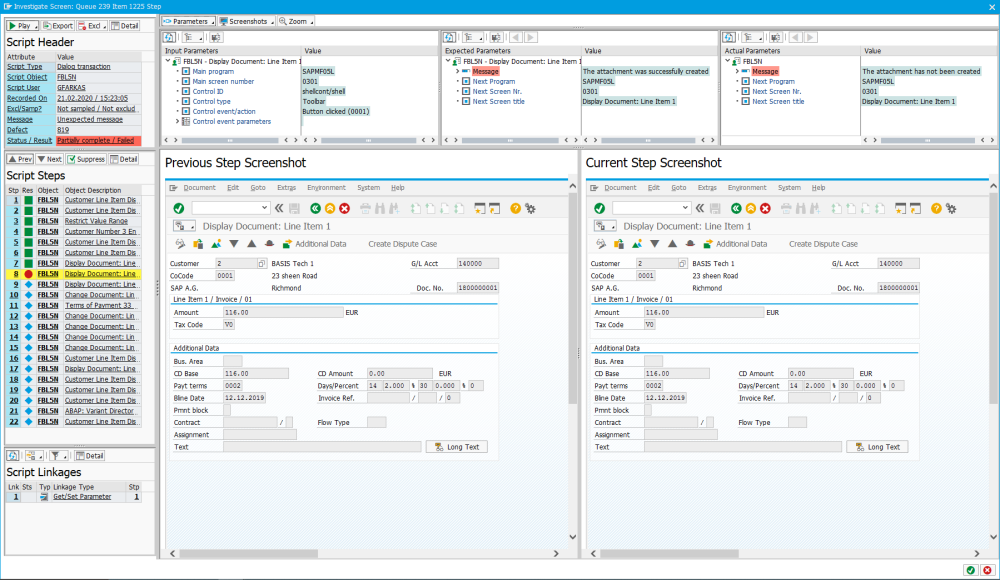
The investigate screen in v2.21 has had a complete overhaul in order to provide significantly more information to users as they investigate script failures. An example of the new screen is shown below:
The investigate screen is broken up into the following sections:
- Header information (top left)
The header information area now has extended information pertaining to the script that is being investigated. This additional information is described in the following section.
- Script steps (left middle)
This part of the investigate screen has not changed too much in this release.
- Related linkages (lower left)
All linkages that have been captured in the recording and are to be used during the playback are now displayed here. Each linkage can be selected and displayed and these various linkage types are now described in the later sub-sections.
- Inputs, Expected Outputs and Actual Outputs
This is shown on the right hand side of the screen and will now vary dependent upon what type of object is being investigated. Also, this area will also be replaced if a linkage is selected for invsetigation. Each of the various object types and how they are now displayed are described in the following sub-sections.


Post your comment on this topic.